Tuesday, June 14, 2011

Government demands Keys to your Home

The citizens of Cedar Falls Iowa made a good argument before their City Council against the City mandating “lock Boxes” containing all entry keys being required outside all commercial property and apartment buildings containing three or more Units.  The Council Ignored the concerns both moral and Constitutional and voted Monday night to pass the ordinance.  They say it’s necessary for the fire department to have immediate access.

http://wcfcourier.com/news/local/article_64b970a2-9624-11e0-93e5-001cc4c002e0.html

This is being done in towns and cities across the nation in the name of safety, but this surely should bring this constitutional issue front and center as more and more rights of the citizen are being eroded before our very eyes
.
How long will it take to encompass all structures including private residences?

One point I did not hear raised at the meeting was that it only included apartments in buildings with more than two units.  It did not include duplex or single family dwellings.   If this is intended to protect citizens why differentiate between apartments and single family dwellings?   Are the rights of the lower class who cannot afford to own their residence less entitled to protections under the Constitution?  Or are the more wealthy property owners of single family or duplex residences less entitled to this level of “protection”

Don’t know about you, but I am already concerned, and seeing things like the blatant violation of Constitutional rights by local officials cause downright fear for my safety.    

Are the Markets Reaching a Turning Point?

  Since its been a while from my last posting I thought I would put up a chart or the S&P E-mini and express my thoughts about what’s going on now in the Markets.  

  All those horizontal lines in the chart represent Fibonacci points based on the wave one of the S&P emini (ES) in 2002.  To complicated to explain here but sometimes I use the S&P Fib based on the wave 1 from the 1929 crash so these factors are basically one fib series extended harmonically to produce support and resistance points into the future based on Fibonacci numbers of major events.  so there.

  The big red line is a major support/resistance point.  This daily chart shows the ES blowing through this like a knife through butter, upwards at the first of this year then coming back to test that point in March producing a low.  Then 3 waves up to make a high, and then the confusion down, sideways and a pretty good collapse.  this down move to test the March low of 1241.25 is either completed or is still testing.  The price came down to that major support and price got to 1259.50 stopping just short of the Fib line at 1259.43.  Missing it by .07 cents and is now bouncing.  The ES closed today dead on the 9 SMA (red MA line) so it can be anyones guess as to what it's likely to do over the next few days but if this is to continue downward a solid test of the March low will be necessary.

  Also (not depicted) the bottom of a regression channel from the March of 09 low is around 1244-1250 So in a continued down move that will be a target.  Bottom line is we have to break through that fib line at 1259.43 to extend this test of the low.  I would be very careful here as this could be the end of the down move for the time being.  Any speculation on direction at this point for me is simply a guess with no indication either way.  So, I guess it would depend on the news and action in Europe.  If money pours into the USD and it keeps going up then the markets will keep moving down otherwise a move to new highs.

  There is one other possibility in the future, and that would re-link the USD to the market and they move in unison but that's for later.  For now the inverse relationship in the dollar and the markets simply means the value of the dollar is dropping and the value in the market is actually holding its own but since the price is expressed in dollars it will naturally go higher.  The value in the markets may be actually down or even, if expressed in other currencies.

Oh, I forgot to add:  The red vertical line running through yesterday's candle is a Fibonacci Time extension taken from October 07 (When this mess really started) to the March 09 low.  That line is the 161.8% point which is also a Major Fib point for trend changes.  I find it interesting that this point in time coincides with Martin Armstrong's end and beginning of, a new 8.6 year wave on his count. 


                                                Click on chart to enlarge


Sunday, May 15, 2011

Mississippi Floods, Economic Damage and Insurance Companies


With all the levees being opened to relieve the swollen Mississippi River Several thoughts occur to me.
First, the obvious concern and sadness for all the folks who may lose everything.  It’s hard to imagine going through such an event. 

Then, one must wonder at the massive economic loss.  Since I am not in the business of gathering such data I will have to wait to get some idea of the exact economic impact to these localities and the nation.  I know it will be huge.  Now comes several legal and moral questions. 

Friday, May 6, 2011

Musings On Silver

In the silver market it is frustrating to get good data for some reason so in order to simplify things I will just use the London fix as a basis.  On January 18th 1980 the close of the London markets logged the highest close on silver at $49.45.  Other sources claim prices ranging from $41.50 to 50.50 and that all depends on the source and what you are talking about … intraday, close or other ways to use a spike high on any particular trade.  So for the sake of argument I will just stick to the London fix on 1 JAN 1980 of $49.45

Silver hit $48.70 on the PM fix in London 28 Apr which is the highest I can find recently.  My research is incomplete as of now but that appears to be correct.  So, comparing Apples to Apples (in this case the London PM fix) what we do have is the makings of a double top when compared to 1980.  The price did not get to the $49.45 of 1980 so I have to view this for now as a failed new high on the Monthly chart.  This double top along with the FNH does not bode well in the interim for silver.  This run however does not appear to be finished and in accordance with Armstrong’s cycle model as we complete an 8.6 year cycle June 13. 


Wednesday, May 4, 2011

Quick look at Gold

Martin Armstrong's 8.6 year wave reaches a transition point on June 13th.  The ideal position for Gold IMO is to bottom between then and the 15th.  This would, according to Marty set the stage for much higher highs.

In order for gold to do this it will take a pretty steep angle on the weekly chart to get back to the regression line I'm using.  This regression line is from the low of 641 through this week.  The line represents simply a mean to golds progress and might just be a target for a low.  Of course blowing through the line and getting a bounce off the 5 SMA (blue line) would be clearly understandable.

Senate Official Complaining about Code Word "Geronimo"

I'm not about to rehash the “Indian” thing or even the “native American” thing, that’s been done Ad nauseam.   

The news today is, some director for the Senate Indian Affairs Committee is objecting to the military using “Geronimo” as a code name for Bin Laden.

I suggest that Loretta Tuell, the director I mentioned just go find something useful to do for crying out loud.  Besides she is a member of the Nez Perce tribe and not an Apache as was Geronimo. It is well known and well documented that the Apache were a war like group and the word in the Zuni language means “enemy”.

Monday, May 2, 2011

Osama Bin laden Death house

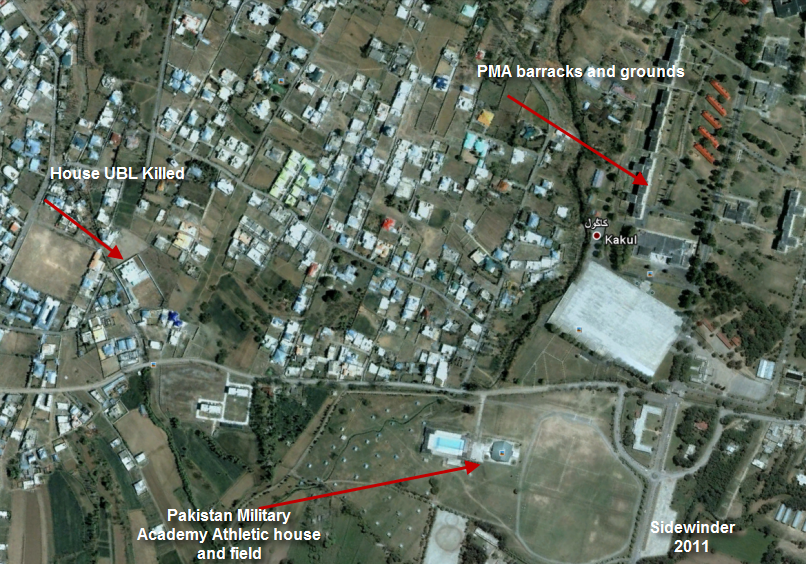
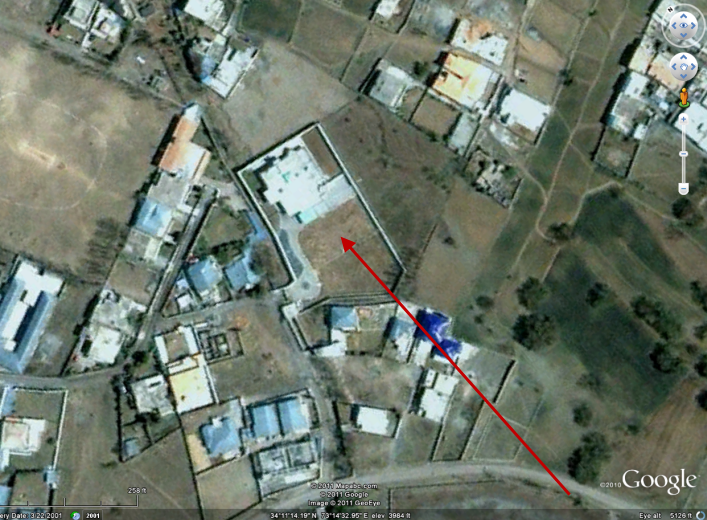
I may be wrong but pretty sure this is the house UBL was killed in.  you can see how close this guy was living to a facility suppose to be the Pakistan Military Academy.  He was right under their noses.  Hard to believe no one knew of this.  I located the compound which looks much like what is being shown on TV now (Sunday) and the coordinates are
 34 11 15.76 N  73 14 33.18 E .

I have seen this relationship shown no where in the media so thought I would put it here.  If I'm wrong I'm wrong but it is what I believe to be the scene. Just click on the photo to enlarge.


And zoomed in......

Tuesday, April 12, 2011

GHOST TOWN - KiddofSpeed - Chernobyl Pictures What Japan may Face in the Future

GHOST TOWN - KiddofSpeed - Chernobyl Pictures 

See comments here


Some years ago I stumbled on a site that I found at the time to be fascinating, educational and generally informative.  The site dealt with the meltdown at Chernobyl or rather the aftermath of that event.  It is the records of a Russian girl named “Elena” who loves to ride motorcycles and loves to make bike trips into the “Dead Zone” in and around Chernobyl. 

This is not just some biker chick the girl has a background in physics and especially nuclear physics.  She understands the dangers and where not to go.  Her father is a nuclear physicist and she has absorbed lots of knowledge on the subject so she seems to know what’s going on. Because of her father’s position as a nuclear physicist she was able to obtain permission to enter the area and has made many trips into the area taking many photos and documenting her trips.