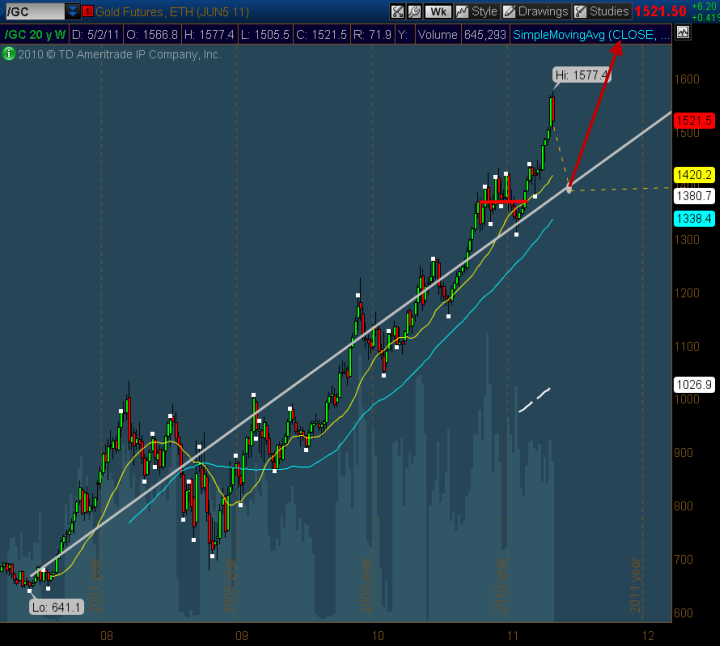
Martin Armstrong's 8.6 year wave reaches a transition point on June 13th. The ideal position for Gold IMO is to bottom between then and the 15th. This would, according to Marty set the stage for much higher highs.
In order for gold to do this it will take a pretty steep angle on the weekly chart to get back to the regression line I'm using. This regression line is from the low of 641 through this week. The line represents simply a mean to golds progress and might just be a target for a low. Of course blowing through the line and getting a bounce off the 5 SMA (blue line) would be clearly understandable.
The angle for the decent is about 62 degrees not unheard of but steep nonetheless. The last time gold had a decent that rapidly on the weekly chart was in 2007, since then most of the pullbacks on gold have been in the vicinity of 51-53 degrees.
In the chart below, I have put a scenario for gold should this play out in this fashion. Gold as you can see, had a fairly long sideways channel of about 3 months duration before this last breakout and now appears to be correcting. This would be in timing with a run at a low mid-June. Of course this is all speculation but interesting to observe in the meanwhile. As usual, click on the chart to enlarge.

No comments:
Post a Comment