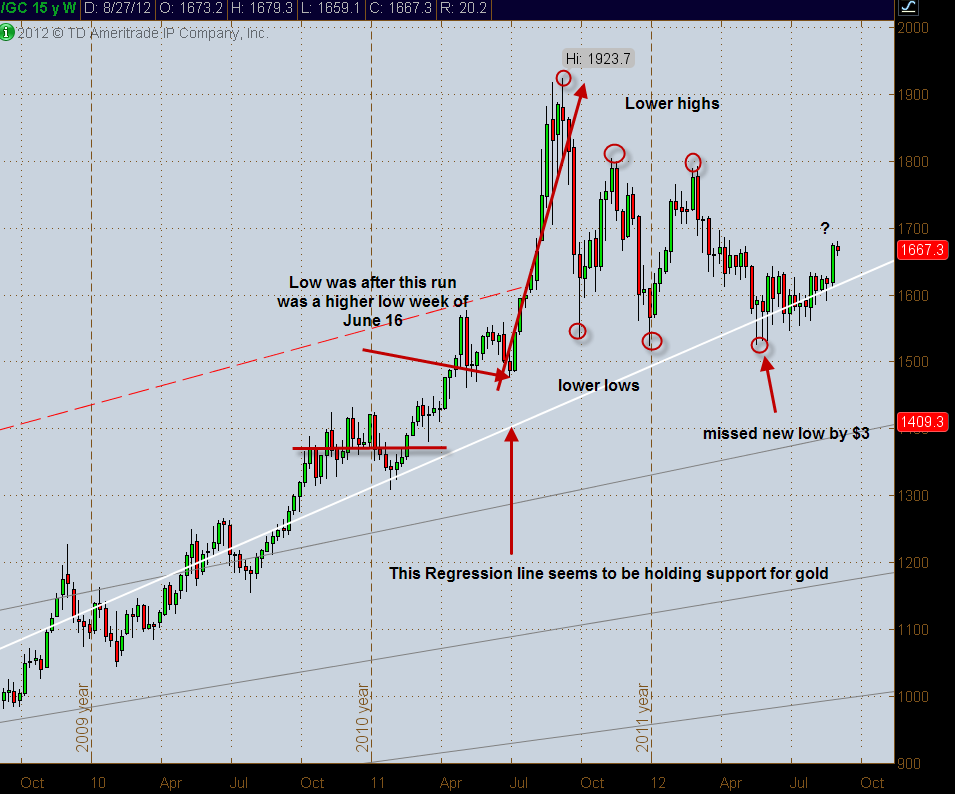
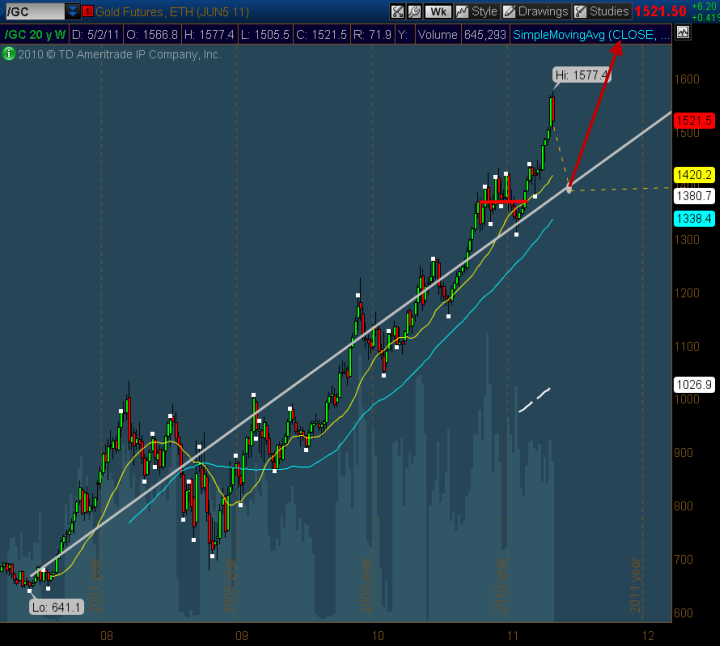
What actually happened was Gold begin its down move in mid June and bottomed the week of June 16th. Not bad for a guess. Chart showing results is below.

Since last year gold made a new high the week of September 15 2011 and has been in a sideways to down trend ever since. Making lower highs and lower lows. UNTIL the low made May 14th which coincidentally produced what's called a 'doji' candle for that week. Doji's many times indicate a change in trend. Since the trend for the past year has been down that might be a good sign for gold. The following week of 5-21-12 was without question the time to go long gold for the mean time. I think gold represents an indicator of confidence in governments and the economy in general.
I can't explain in a few paragraphs what's been going on with the attempts to keep gold down by governments and others but will leave it as this is one perception they don't want to lose a grip on. As things progressively get worse for the politicians gold will continue it rise. It has definitely changed trend for the time being, now it's just a matter of a confirmation on the trend change. That confirmation will come by making a higher high perhaps sometime in November. It needs to break above about 1790 and hopefully above 1805 to prove it's on a roll to me. THEN I wait for a pull back to enter if wanting in and have not already entered back in May/June.
Armstrong's computer says the following: "Looking at our empirical models, the ideal primary target for the next turning point appears to be March 2012 thereafter we see a two-month move in the opposite direction initially there appears to be a fairly large change in Trend developing in September of 2012 which can lead to a move into the January 2013. Therefore if March unfolds as a reaction high we could see a retest of support in May with a reaction high into August for Labor Day and a decline into a final low in January 2013. It is clear that January 2013 should be a very important target. If that is a low then we should be able to see a significant rally into 2017 thereafter.”
I rarely disagree with Martin's forecast. This Little burst upwards could really just be a reaction high followed by a decline into January. That would be the best scenario for a big rally lasting years in gold.

No comments:
Post a Comment